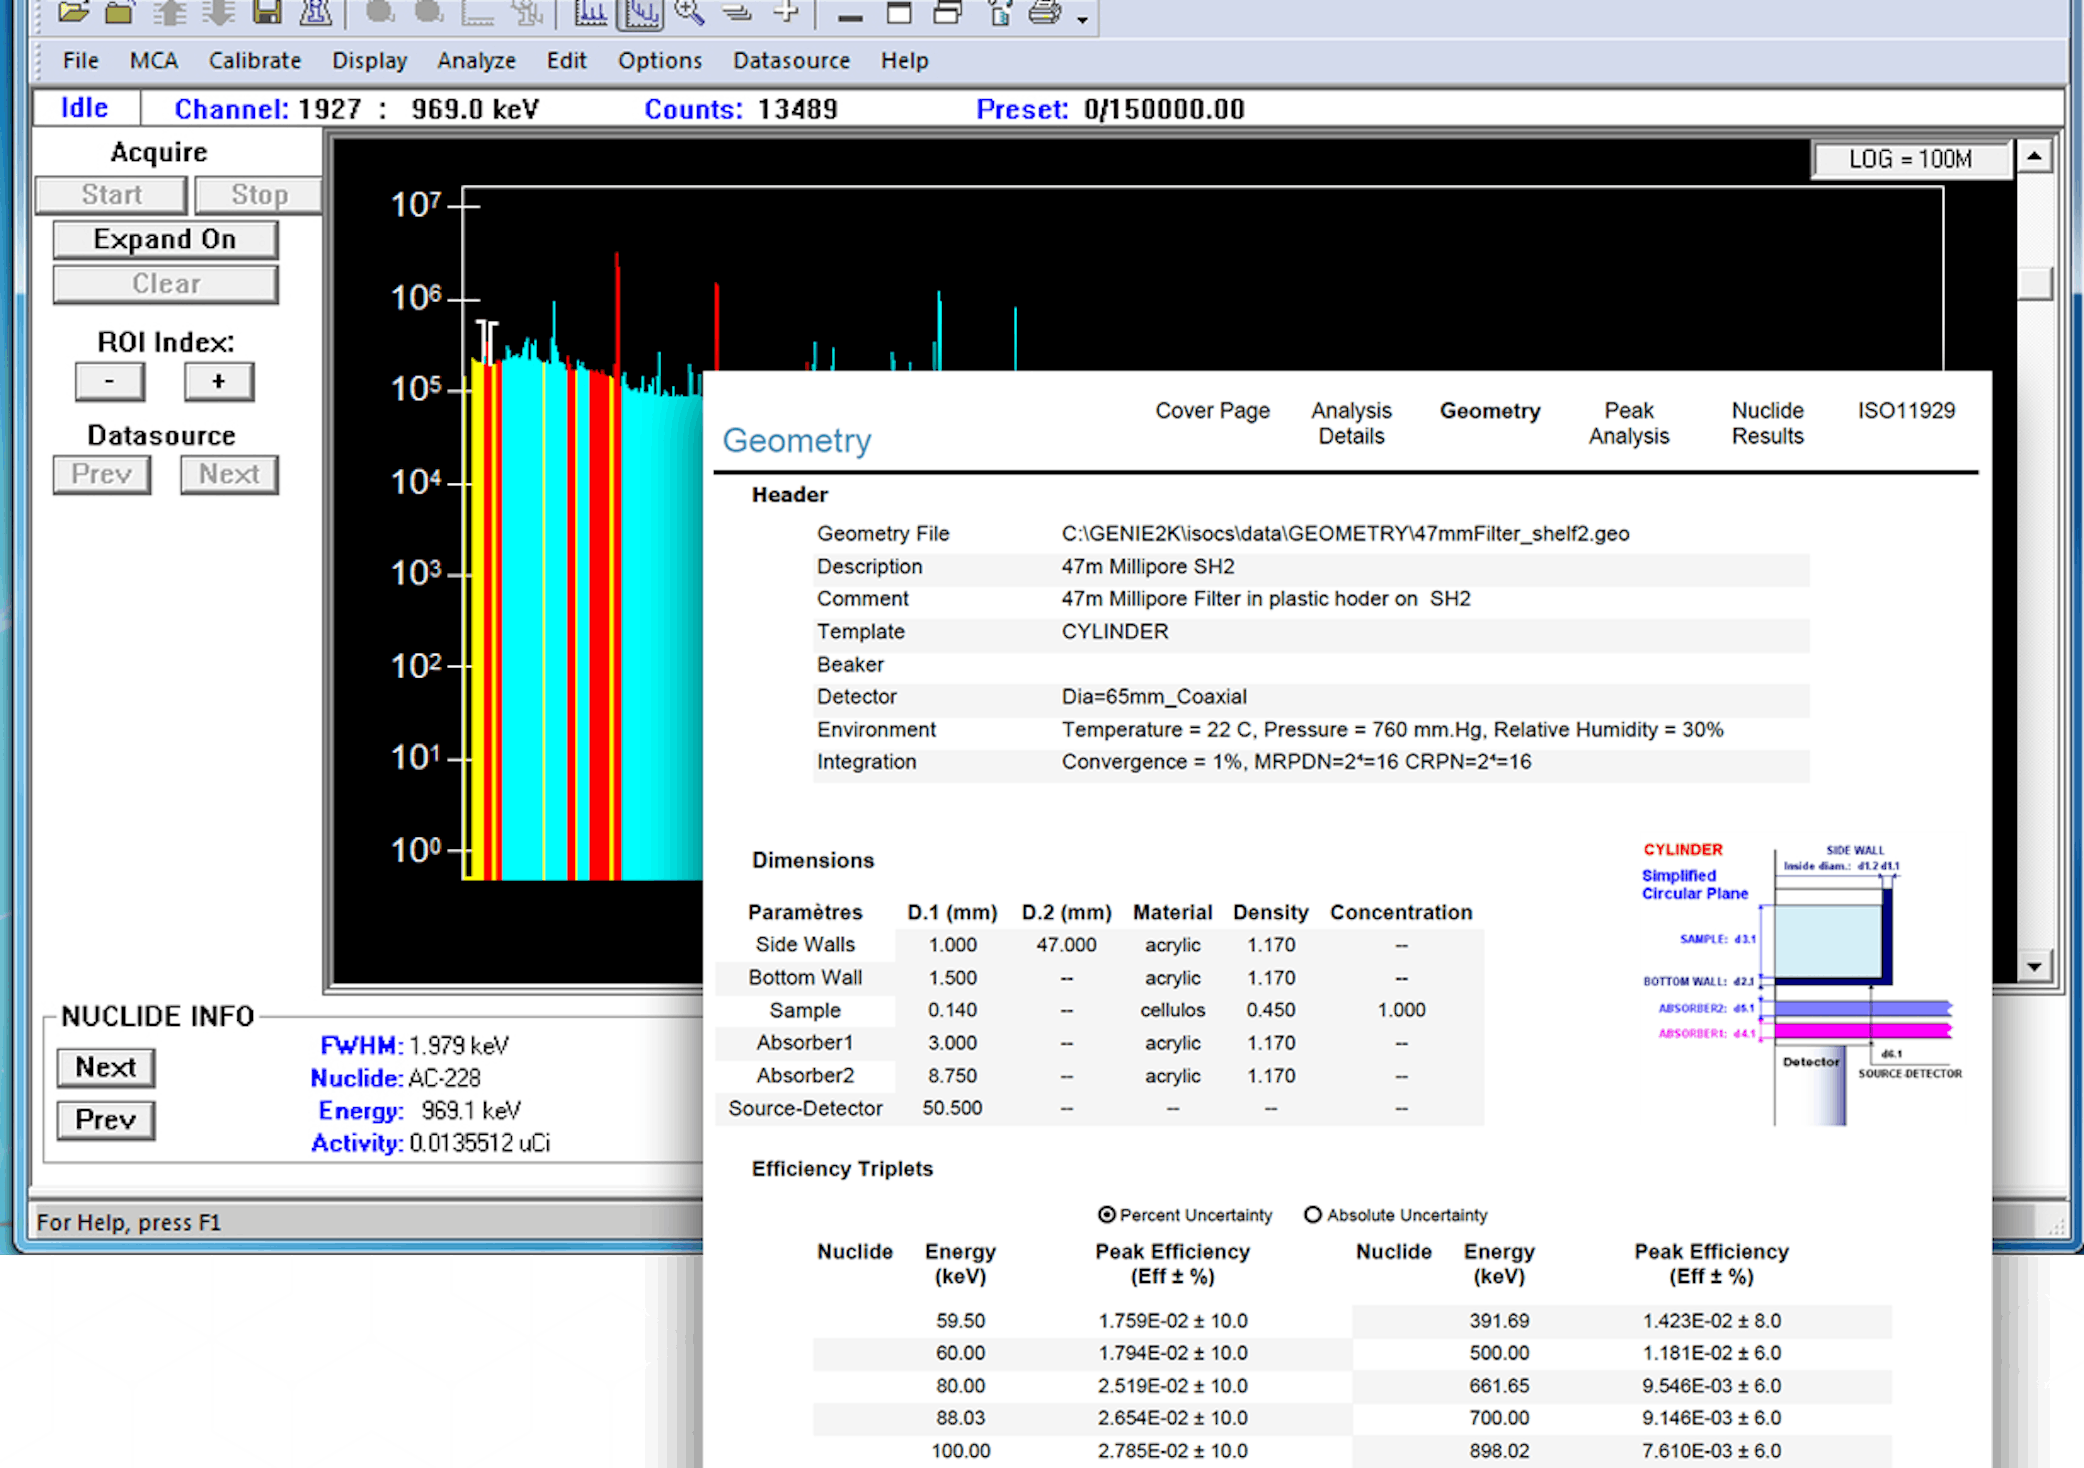
Considerations for Environmental Gamma Spectroscopy Systems
|
Introduction
As public and government attention becomes focused on environmental concerns, some of that attention is being directed towards nuclear facilities. The nuclear industry is being called upon to clean up old contamination and to verify that new contamination is not occurring.
Additionally,
utilities and local communities are expected to be ready to monitor
environmental contamination in the event of an accidental release or
major nuclear event. These activities all require measurement systems
and techniques that address the special problems of environmental gamma
counting.
Environmental measurements are being made by federal government agencies, state health departments, public utilities and private contractors.
This application note discusses the special problems associated with environmental counting and presents methods by which those problems can be addressed.
The nature of various types of environmental samples is discussed. Distinctions are drawn between applications involving low levels of radioactivity as found in routine monitoring and higher levels as found in contaminated sites.
The unique problems of measuring environmental samples are addressed. Specific problems of interfering isotopes and discrimination of naturally occuring nuclides vs. man-made contamination are explored. Also discussed are the special problems of low-level counting, in-situ counting and counting at highly contaminated sites. Attention is also focused on user skill requirements.
The Nature of Radiation in the Environment
Origin of Environmental Radioactivity
One of the most obvious sources of radionuclides in the environment is nature itself. Many measurements that seek to establish humankind's impact on the radiological characteristics of the environment are complicated by the existence of primordial nuclides in soil. Particularly in areas of igneous geology, concentrations of Uranium (U) and Thorium (Th) series nuclides as well as naturally occuring Potassium (K) are significant.
For practical purposes, the sources of greatest interest in most environmental radiological studies are the nuclear fuel/weapons cycle and major nuclear events.
Studies of radioactivity from these sources fall into two general categories:
1) Routine monitoring of the areas around nuclear facilities to verify that nuclear contamination has not occurred, and
2) extensive assay of areas of known contamination to characterize those areas and facilitate remediation efforts. This includes cleanup efforts of past disposal sites, facility decommissioning and cleanup of accidental waste spills.
The nature of the measurements from these two categories will vary widely. In general, routine monitoring efforts involve very low levels of radioactivity. In these cases, measurement systems need to be optimized for low level counting. On the other hand, measurements of known contamination areas can involve high levels of radioactivity, presenting a different set of problems.
Interestingly, both types of applications can involve highly complex samples, due to the existence of primordial nuclides alluded to earlier. The myriad of measurement problems associated with these applications will be addressed in a later section.
Transport of Radionuclides in the Environment
The characterization of an environmental survey area would be significantly simplified were it not for the tendency of materials to move through the environment.
Since the primary consideration in environmental measurement is the assessment and prevention of possible health effects on humans, it is important to understand how radioactive materials can move from a release point to possible ingestion.
Radioactive materials can be released into air or directly into water or soil. When released in the air, they can travel some distance, depending upon such factors as wind speed and direction and altitude of the release.
The products of airborne releases can be transported to humans by a variety of paths. First, direct ingestion by inhalation is possible. Secondly, the materials will eventually deposit themselves on the ground, where they will find their way into plant and animal life and thereby, into the food chain. Third, deposition of airborne contaminants into water can reach humans either by direct ingestion or via the food chain.
Similarly, direct soil and water depositions find their way into the food chain via both plant and animal life. Rain water runoff can carry soil into rivers and streams, thereby transporting any soil contamination to water. Additionally, radioactive materials can leach into porous soils and into ground water.
Figures 1 & 2 show some of the possible pathways of contamination to humans.

Figure 1

Figure 2
*Source: "Radiological Characterization of Surface
Soil"
Professional Enrichment Program Course Materials
Health Physics Society, 35th Annual Meeting, June 24, 1989
Problems and Solutions in Environmental Counting
Sample Collection and Management
Many environmental surveys involve large numbers of samples. Samples are collected in the field, identified, transported to the laboratory, logged in and separated into subsamples. Each subsample then may undergo chemical preparation (depending on the tests to be performed) and finally, counting, analysis and reporting. Then, the multiple subsample reports need to be reviewed and combined into a single data packet.
Obviously, such a process must be closely managed to ensure consistent and correct operating procedures are followed. Procedures must prevent misplacement of samples, cross contamination of samples or equipment and improper data entry.
For most laboratories, this requires a rigorous sample tracking system. A "Chain of Custody" record is maintained for each sample, where processes are logged as they are performed and individuals sign (and in some cases, have witnessed countersignatures) indicating that a task is completed.
For large laboratories, this generally may involve the use of a Laboratory Information Management System (LIMS) using multi-user minicomputers to manage multiple instruments, samples and personnel. For smaller laboratories, paper based management systems can be perfectly adequate.
Shielding for Low Background
Environmental samples are mostly low activity samples. The correspondingly low count rates associated with these samples can complicate the measurement techniques.
To minimize the amount of background radiation in the measurement of a low activity sample, the environmental samples should be measured in a shield. However, the shield can also be a source of background and should be considered carefully when setting up an environmental measurement station.
It has been established that the optimal shield thickness is 4 to 6 inches. Less thickness may not provide enough shielding and more thickness produces more background due to cosmic interactions with the shield.
Lead is the shielding material of choice for most applications. However, lead does give rise to Pb x-rays which can cause problems at the low energy end of the spectrum. If low energy gamma rays are of interest, the x-ray interference can be minimized with a shield lining of tin and copper. A shield such as the Canberra 747 or SPG-16 meets the requirements.
Where samples have high energy components which create a high Compton continuum, an anti-Compton shield can be used. For ultra low backgrounds, the system may be installed underground or in a basement or cave. Neither of these solutions are required for the typical environmental lab, but may be called for in extreme cases.
Electronics in Low Level Counting Systems
The general rule of thumb is: the lower the activity, the longer the count time required to get adequate counting statistics for a dependable analysis. Not counting long enough will cause poor peak formation and lower the confidence in the both the quantitative and qualitative analysis, particularly if multiplets are present.
Unfortunately, long count times solve one problem and potentially cause others. As the count time increases, so does the risk that changes in the electronics will cause distortions in the data. For example, gain shifts can result from large changes in ambient temperature or from power voltage fluctuations. Improper setting of pileup rejection circuitry (not generally needed at such low levels anyway) can cause improper correction of live time, particularly in older amplifiers, etc.
Today's modern electronics minimize most of the problems. In the last 5 years, significant strides have been made in temperature stabilization and power fluctuation sensitivity. Nonetheless, some moderate precautions are in order.
First, take steps to stabilize temperature around the counting system. Saving a few dollars by turning off the heat or air conditioning while counting overnight will not be worth the effect it can have on the data. Secondly, well regulated power will minimize the possibility of shifts due to power fluctuations.
Use a digital stabilizer such as the Canberra Model 8232, if there is any doubt that the above measures will eliminate the potential problems. Finally, do not use pileup rejection circuitry, except where higher activity samples are being counted. If pileup rejection is needed, use one of the latest model shaping amplifiers, such as the Canberra Model 2025.
Detector and Geometry Considerations
Another way to reduce potential problems with long count times is to use various methods to shorten the counting time required to meet a given MDA. As an added benefit, reduced count times can improve the productivity of the whole lab by processing more samples in less time.
There are two ways to accomplish this, both of which involve potential problems and trade-offs. First, a reduction of the distance between the sample and detector improve the counting geometry by approaching the ideal 2p configuration. As such, more gamma rays are seen by the detector, the efficiency improves and the required count time drops.
Similarly, larger detectors trap more gamma rays at a given spacing, thereby reducing count times. Combining large detectors with minimal spacing would seem to achieve the lowest possible count times.
However, problems are introduced by either approach individually and magnified if both are used together because the probability of cascade summing is increased.
Cascade summing arises from the phenomenon whereby a single nuclear decay emits two gamma rays of different energies at virtually the same time (in a cascade). If both gamma rays are trapped in the detector, a summing effect causes removal of events from the full energy peak into a summed peak and into the Compton background.
At either a short sample to detector spacing or with a larger detector, the probability of such summing increases dramatically. Larger detectors exhibit the cascade summing effect at larger distances. If the throughput of a given detector is optimized by using the smallest sample to detector distance that still does not exhibit cascade summing effects, the advantage of the higher efficiency detector is mostly lost due to the necessity of keeping the sample farther away.
This phenomenon is shown in Figures 3a and 3b. Data were collected for Cs-137, which does not exhibit a cascade effect, and Co-60 which does. The normalized ratio is simply the ratio of peak areas (Co-60/Cs-137) at the various source to detector distances divided by the same ratio at a large distance. These data were taken at several source to detector distances. Note that for the larger detector, the losses due to cascade summing appear at much larger distances.

For an example of how to test for cascade summing, see the new ANSI 42.14 Standard.
Another potential geometry related problem is the possibility of source placement error at close distances. At larger sample to detector distances (e.g. 10 cm) a 0.5 cm inaccuracy in sample placement is not significant. However, at 1 cm distance, a 0.5 cm inaccuracy is very significant indeed.
If close sample to detector distances are required, the amount of cascade summing as a function of distance should be established for each detector in use and for each nuclide of interest. If the option exists, the sample to source distances should be selected in such a way that no cascade summing occurs.
To minimize placement error, each detector should be equipped with a sample holder (or several sample holders) that allow placement of all samples in very reproducible geometries.
If the potential cascade summing effects are accounted for, larger detectors can offer improved overall sample throughput. They are not, however, a panacea as is sometimes suggested.
A suggestion to replace multiple smaller efficiency detectors with a single very large detector to increase throughput should be viewed carefully from an operational / logistical standpoint. Most labs would find that such a reduction in detector redundancy would present a risk too large to tolerate.
Even with the very best service turnaround times, few labs can afford to be completely shut down during an outage caused by either failure or routine service requirements on a single detector. The redundancy provided by several detectors ensures that detectors can be taken off-line for routine servicing or redress of a failure without affecting the whole operation.
Additionally, many environmental labs, particularly if they are involved in site cleanup or accident response need to be able to count highly radioactive samples. Counting hot samples on an ultrahigh efficiency detector can be quite problematic.
Most labs find that a mix of detectors of various sizes and configurations give them the flexibility and the redundancy to service their clients most effectively.
Problems with Spectral Complexity
Spectra taken from environmental samples can be quite complex. The origin of this complexity is twofold. First, there are many naturally occuring primordial nuclides, in addition to possible nuclides of interest, found in these samples. This is particularly true for soil samples, but can occur in water samples and other types of samples as well.
Secondly, the matter of spectral complexity is further complicated by the fact that activities are generally very low.
An example of an evaporated water sample is shown in Figure 4. An example of a soil sample is shown in Figure 5.

Figure 4

Figure 5
This sample complexity leads to a variety of measurement problems.
1) Environmental spectra often exhibit peaks that are, in fact, multiplets. If the multiplet components are very close together (sometimes appearing as a singlet to the naked eye), or if there is a large height ratio between components, it can be quite difficult to resolve the components.
Most peak search techniques will have difficulty resolving these multiplets into their components. This complicates both nuclide identification and eventual quantification. The problem is further compounded in multiplets with many components.
2) For low level samples, at or near the limit of detection, a peak is sometimes present and sometimes not. This poses a difficult analysis problem because a) if the peak is present, it needs to be identified and included in the analysis and b) if the peak is not present, the nuclide that would generate it must still be identified if enough of its other energies are present.
To handle case 1, Canberra's SAMPO 90 gives the analyst many tools to deal with multiplets. Where difficult multiplets may be present, the best way to be sure of the results is with a statistical verification using a graphical fit display. SAMPO 90 lets the user view the fits on a residual graph for each multiplet fitting region - either automatically while performing the analysis or in an interactive manual mode. This lets the user verify that the fitted peaks fall within statistical limits of acceptability and account for any apparent anomalies.
If poor fits are apparent, the interactive fit mode of SAMPO 90 allows actual adjustment of the results by manually inserting hypothetical peaks and verifying that they in fact exist by examining the recalculated residuals. The spectroscopist can try numerous scenarios on a complex multiplet to determine the best fit before committing the analysis to a permanent record.
To be useful, an interactive peak fit must be easy to operate - intuitive and graphical in nature. With SAMPO 90 the user can perform complex interactions and view results on a single screen. Multiple fitting modes and background types contribute to the flexibility available in the analysis.
For the toughest cases, SAMPO 90's interactive peak fit has a mixed fitting mode that allows some peak locations in a multiplet to be fixed while others are floated during iterative fit calculations to obtain the best possible fit.
See Figures 6 - 8 for an example of an interactive peak fit session.

Figure 6 - Initial Fit: High Residual Show Possible
Multiplet.

Figure 7 - SAMPO 90 Positions the Cursor on Possible
Location of Additional Peak.

Figure 8 - Peak is Interactively Added. Recalculated
Residuals Show Improved Fit.
For case 2, the sophisticated matrix analysis method employed in SAMPO 90 can handle the identification and quantification of nuclides with missing peaks. The same matrix method can also handle the unresolved multiplet situations.
High Activity Environmental Counting
As discussed earlier, special problems arise in applications involving known contamination in the environment. Typically, these involve measurements taken at or near facilities that in the past have been involved in some part of the weapons/fuel cycle. Such applications involve site/plant decommissioning and waste site cleanup. Measurements taken near the site of a major nuclear accident, such as the Chernobyl site, would be similarly characterized.
Frequently, these applications involve samples that are both very complex and highly radioactive. An example of the type of spectrum that can result from this type of application is shown in Figure 9.

Figure 9
Also these spectra often have a major low energy component that will be difficult to analyze if collected with a standard P-Type detector. In these cases, use a Canberra Reverse Electrode (REGe) N-Type detector or the unique eXtended Range (XTRa) P-Type detector to gain the needed performance in the critical 70-120 KeV range.
Most of the same methods as used in the low activity samples apply for these samples as well. However, count rate related problems, if the samples are not low in activity also need to be taken into account.
High count rate applications generally require special electronics. Amplifier and ADC performance is critical to achieving the best throughput without a corresponding degradation in resolution.
Products like the Canberra Model 2024 Fast Spectroscopy Amplifier and Models 582 and 8077 ADCs provide the performance needed.
One of the characteristics of a spectrum counted at high rates is the tendency for peaks to both broaden and develop tails. SAMPO 90 compensates for this nicely by allowing calibration for width, high tailing and low tailing. No other commercially available software offers this capability.
Where complexity and high activity are found in the same spectrum, the interactive capabilities of the analysis software become still more important. In fact, it is recommended that a visual confirmation of such results be undertaken on as many of these spectra as possible. The automated analysis should be thought of as a first pass, with visual confirmation and, if necessary, interactive correction performed by a competent spectroscopist before the results are accepted.
For an extensive tutorial on high count rate spectroscopy, see the Canberra Application Note entitled A Practical Guide to High Count Rate Germanium Gamma Spectroscopy.
In Situ Measurements
In situ measurements are measurements taken directly in the field. In most cases, these types of measurements are used only for survey information or to identify locations that may require further laboratory assay of samples.
In most cases, simple gross counting survey instruments are used to identify hot spots that are then studied further with spectroscopic measurements.
However, there are cases where a more spectroscopic measurement is needed in the field. For example, when surveying an area of primarily igneous rock formations, the quantity of naturally occurring primordial nuclides may be such that activities look high, but no man-made contamination is found. This requires a specific nuclide analysis rather than a simple gross count.
When this type of measurement is required, the spectroscopist faces a new set of difficult problems. Most of the problems alluded to above are more difficult to address and control under field conditions and consequently become more severe.
For example, it is far more difficult to effectively shield the sample of interest from background. Temperature stability is likely to be harder to obtain. It is exceedingly difficult to obtain a reproducible geometry. Finally, equipment needs to be specifically designed for field use. Specifically, it must be both rugged and portable.
Fortunately, equipment is available that addresses the concerns of field spectroscopy. A portable detector shield, such as the Canberra 717, while falling far short of the performance of a 4" lead shield, still provides adequate shielding for quick survey measurements while offering portability. These shields are specifically designed to accommodate the Multi Attitude Cryostat (MAC) mounted detectors common in field use. MACs can offer liquid nitrogen holding times as high as 5 days.
Detector Tripods such as the Model 7413 offer a built in level and adjustible detector elevation from 30 cm to 120 cm, assuring reproducible detector to source geometries.
Finally, the Portable PLUS pairs a laptop computer with a rugged electronics chassis for reliable, battery powered field work. By using a laptop computer, full spectroscopic analysis is available on the spot with SAMPO 90, far exceeding the capability of yesterday's MCA only portable systems.
User Skill Requirements
Of course, in any operation, it is the people that are critical to the performance of the whole system. It is essential that users be as knowledgable as possible, and that they be provided with the tools to minimize the possibility of errors.
Experience in proper handling of sources and samples, avoidance of cross contamination and decontamination of tools and materials are all important. More errors are introduced by improper sample preparation and mounting than by improper operation of measurement equipment.
Spectroscopy systems are easiest to operate when they are designed to allow custom defined procedures to be written that are specific to the application. Both the Canberra AccuSpec PC based products and Genie VAX based products offer extensive automation capabilities that let the user fully define the counting procedure.
The user defines the precise flow of the assay procedure, deciding where defaults are to be used or where the operator should receive prompts for parameters. These systems even allow the user to stop an analysis sequence and examine intermediate results, deciding whether to continue or make adjustments before proceeding.
Specific training is available from Canberra on all of the products mentioned in this note. Additionally, comprehensive training is available on the techniques and applications involved in its use.
|
| Top of Page |
